


Market Update - January 2026
Year-End Rally Continues as Valuations, Rate Uncertainty, and Geopolitics Resurface
Markets started 2026 on a cautious note as the post-election euphoria of late 2025 gave way to harder questions about valuations, the pace of Fed easing, and global growth trajectories. The S&P 500 posted a modest year-to-date gain of +1.5% through January, but beneath the surface, style and sector leadership shifted decisively: value handily beat growth, small and mid-caps outperformed large caps, and international markets - particularly emerging markets and select developed regions - delivered stronger returns than US equities. Technology, which had been the dominant force through much of 2025, stumbled (-1.7% YTD), while defensive sectors and commodity-sensitive plays gained ground.
The rotation reflected a broad repricing of 2026 expectations. With the Fed signaling a more cautious approach to further cuts, and inflation data continuing to improve (albeit modestly), rate-sensitive mega-cap growth names lost momentum. At the same time, international equities benefited from a stabilizing dollar, improving sentiment toward China's stimulus measures, and Europe's surprisingly resilient consumption. Commodities surged, led by gold and silver, which continued their multi-quarter run as hedges against geopolitical risk and monetary uncertainty, but faded quickly at the end of the month, calling into question the sustainability of the parabolic rally we’d seen over the last several months.
Asset Class Review
Equities - U.S.: Value and Small Caps Shine as Mega-Caps Take a Breather
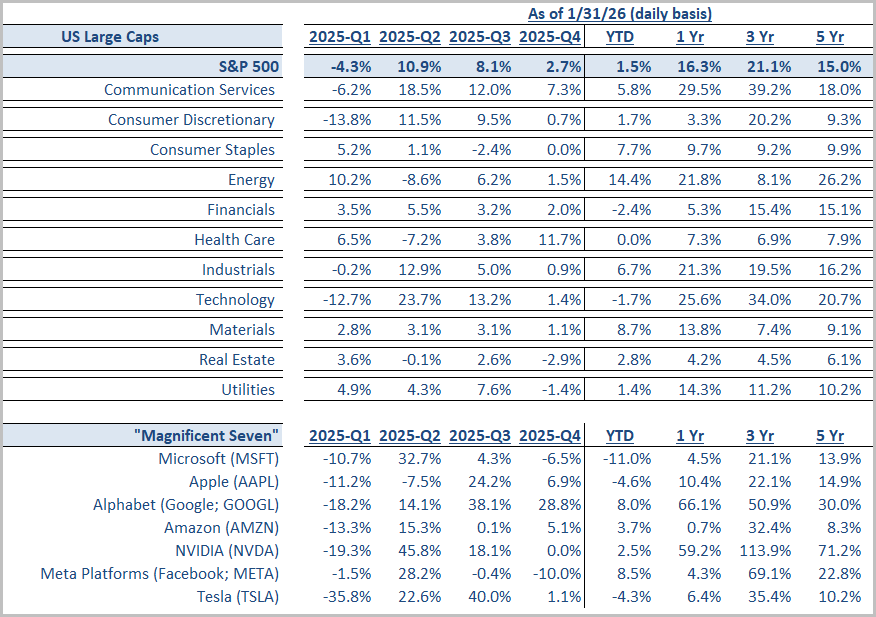
US equities posted a modest gain in January (S&P 500 +1.5%), but the real story was a sharp rotation beneath the surface. Last year’s leaders faltered - Technology (-1.7%) and Financials (-2.4%) lagged, while Energy (+14.4%), Materials (+8.7%), and Consumer Staples (+7.7%) surged, reflecting a shift toward pricing power and cash flow in an uncertain backdrop. Industrials (+6.7%), Communication Services (+5.8%), and even Real Estate (+2.8%) added to the broader rebound. Style and size trends echoed the move: Value beat Growth (+4.6% vs. -1.5%), small caps outpaced large caps (Russell 2000 +5.4%), and equal-weighted indexes led, signaling a healthy broadening of market leadership rather than risk aversion. This was not a wholesale flight from risk, but rather a repositioning of risk: investors rotated out of the priciest growth names into both defensive havens and cyclically geared value plays, leaving broad market volatility relatively low.
Within the celebrated “Magnificent Seven” tech mega-caps, winners and losers diverged. Meta (+8.5%) and Alphabet (+8.0%) were notable gainers, supported by robust year-end earnings and, in Alphabet’s case, AI product momentum. But other titans slipped: Apple (-4.6%) finished the month lower, while Microsoft (-11.0%) had one of its worst months in history, and Tesla (-4.3%) continued to seesaw on fickle sentiment. In sum, US equity leadership broadened dramatically in January. The AI-driven mega-cap trade took a rest, allowing the market’s foundation to widen as previously underperforming sectors and smaller companies stepped into the return stream.
Equities - International: Developed Steady, EM Explode Higher (Korea and Brazil in the Lead)
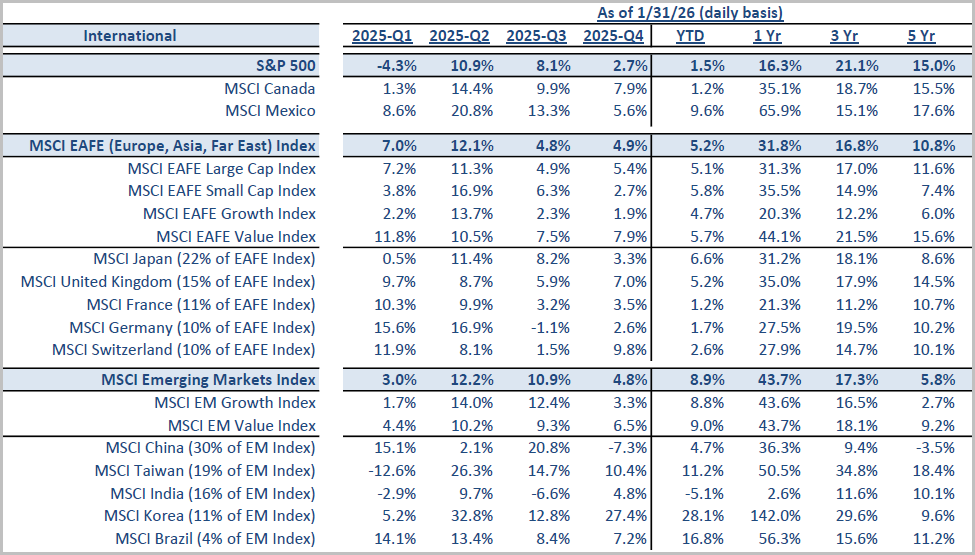
International stocks started the year strong, outpacing US peers. The MSCI EAFE Index (developed markets) rose +5.2% in January, benefiting from both the global rotation into value and some region-specific tailwinds. European markets in particular saw gains in defensives and cyclicals alike. The UK (+5.2% YTD) and Switzerland’s market (+2.6%) were buoyed by staples and pharma, while Germany (+1.7%) and France (+1.2%) managed smaller advances amid mixed economic data. Japan’s market jumped +6.6%, continuing its upswing as corporate reforms attracted investors. Notably, within EAFE, Value shares (+5.7) outperformed Growth (+4.7%).
Emerging markets were the clear equity standout in January, with the MSCI EM Index surging +8.9% and outperforming both US and developed peers. Gains were driven by EM Asia, where South Korea soared +28.1%, extending its tech-fueled rally, and Taiwan rose +11.2% on continued hardware demand. In Latin America, Brazil jumped +16.8% as rising commodity prices and easing inflation lifted sentiment. In contrast, China lagged with a modest +4.7% gain, held back by weak data and continued property sector overhangs, while India fell 5.1% amid stretched valuations, rising oil costs, and foreign outflows. The dispersion underscores the need for diversification across countries. Export-led and reform-focused EMs are leading, while structurally challenged markets continue to trail despite a supportive global backdrop.
Fixed Income: Yield Curve Steepens as Short End Treads Water and Long End Rises Modestly
Bonds started 2026 on a quiet note. After bouncing back and forth last year, interest rates steadied in January. The Bloomberg US Aggregate Bond Index returned +0.1%, and the broad Global Aggregate index was up similarly. US Treasuries were essentially flat (+0.1%). The 10-year Treasury yield ticked slightly higher from December’s level to 4.26%. Investors are increasingly doubting the Fed will continue easing rates at the pace imagined in late 2025.
Credit markets were steady and supportive in January. Investment-grade bonds returned +0.2%, while high yield gained +0.5%, both modestly outperforming Treasuries as credit spreads remained anchored near historical norms. Solid corporate earnings, abundant liquidity, and healthy demand for new issuance helped keep default concerns muted. Emerging market dollar debt also advanced +0.4%, buoyed by stronger EM currencies and improving risk appetite. Municipal bonds returned 0.9%.
Real Estate: REITs Rebound - But Dispersion Persists
Real estate posted a modest rebound to start the year, with the FTSE Nareit All REITs Index up +2.8% in January as drifting long-term yields and a broader rotation into income assets renewed interest in the sector.
Alternatives: Commodity Surge Pops, While Crypto Flattens Out

Alternative assets had a dynamic month, led by a breakout in precious metals and broad commodity strength. Gold and silver’s remarkable run picked up steam late in the month. However, what began as a powerful rally unraveled within hours on the last trading day of January into one of the sharpest commodity crashes on record. Silver plunged 26%, the largest one-day decline ever, while gold sank 9% in its worst day in over a decade. Copper traders were already shaken after a rapid spike above $14,500 per ton reversed almost immediately.
Still, these moves capped an extraordinary 12-month stretch (gold +78%, silver +287% YoY) powered by persistent geopolitical tensions, rising expectations of global rate cuts, and investor appetite (especially in China) for tangible stores of value. Positioning and momentum are now key drivers - both metals had entered technically overbought territory, although fundamental support (easing real yields, central bank buying, etc.) remains in place.
In contrast to the metal rallies, digital assets were notably subdued. Bitcoin traded lower; the iShares Bitcoin Trust was -4.1% on the month. After 2025’s volatility (including a -23.5% plunge in Q4), crypto markets seem to be searching for a narrative amid competing cross-currents. On one hand, lower rates could revive speculative interest, but on the other, increased regulatory scrutiny and gold’s renaissance have siphoned attention. For most of the month, “digital gold” failed to emulate real gold’s traditional safe-haven characteristics, highlighting the different forces at play.
Looking Ahead: February 2026 & Early Q2 Trends
As February begins, the key question is whether January’s rotation marks a lasting shift or a short-lived rebalancing. The rally’s broadening into value, small caps, emerging markets, and real assets suggests optimism around a soft landing, but also measured risk management. For the shift to hold, continued economic resilience and subdued inflation are critical. While disinflation is expected to continue into Q2, a resurgent commodity advance could complicate that picture. The Fed, having already cut 175 bps since late 2024, is expected to stay mostly on hold, with markets pricing only gradual easing ahead. Some officials remain cautious, warning against aggressive cuts with core inflation still above target, keeping bond yields range-bound and putting the burden on earnings rather than valuation expansion.
Key catalysts in the coming weeks include Q4 earnings and macro data - particularly jobs, ISM, and inflation - testing the durability of the soft-landing narrative, as well as the threat of another US government shutdown. Globally, investors will be watching for signs of traction in China’s post-holiday stimulus and a clearer turn in Europe’s economic data. Meanwhile, geopolitical risks, regulatory developments, and possible leadership changes at the Bank of Japan could inject volatility. January’s rally hinted at a market ready to move beyond narrow mega-cap leadership. If growth steadies and inflation stays contained, this rotation could fuel a more inclusive bull market.